Short description
Purchase Analysis shows you at a glance how much you purchased in a period — broken down by category, brand, purchase source, sourcing method and sheet. You can immediately spot which areas dominate your purchase volume and where focus is shifting.Requirements
- Google Sheets permission (for sharing with family members)
- At least one Sourcing Mastersheet with recorded purchases
Overview page layout
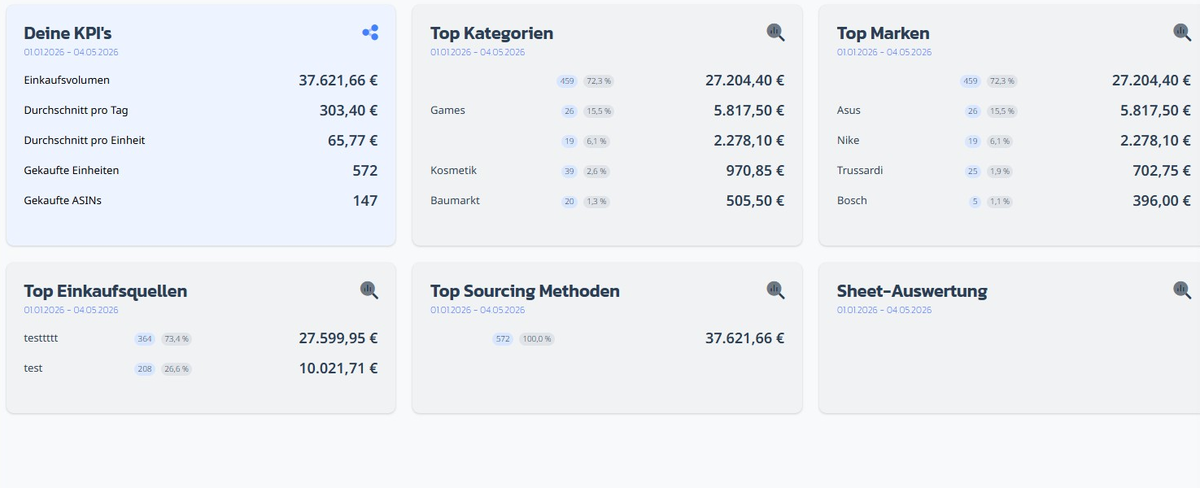
Purchase Analysis consists of several cards, all evaluating the same time range and the same sheet.Filter bar at the top
- Sheet selection — choose a single Sourcing Mastersheet or all sheets
- Date range — quick selection or custom range

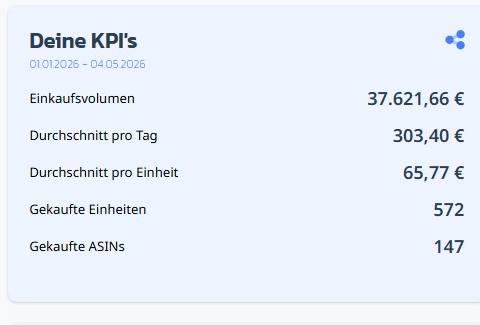
”Your KPIs” card
Shows the key metrics for the selected time range:- Purchase volume — total of all purchases
- Average per day — volume divided by days
- Average per unit — volume per purchased unit
- Units purchased
- Purchased ASINs — number of distinct products
Top cards
Per card you see name, units purchased, percentage share of purchase volume and euro amount:- Top categories — grouped by product category
- Top brands — grouped by brand
- Top purchase sources — where you bought from (source shop)
- Top sourcing methods — which strategy led to the purchase
- Sheet analysis — purchase volume per Sourcing Mastersheet
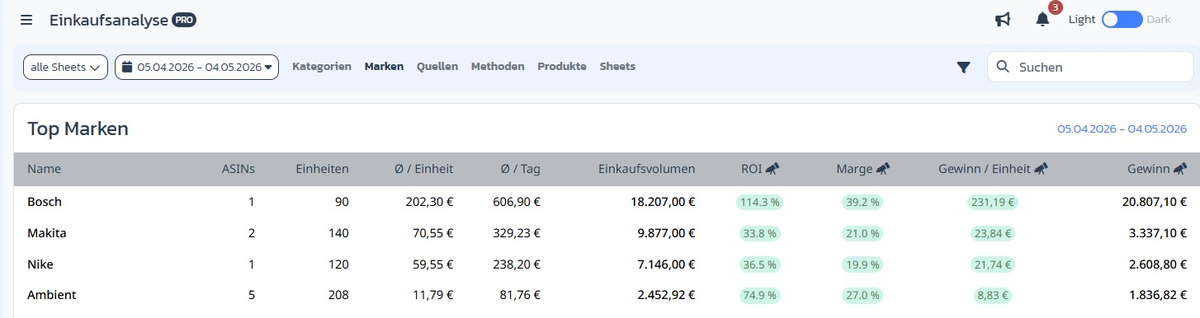
Detail page (PRO)
When you click the magnifying glass icon, you land on the corresponding detail page. At the top you see the sub-navigation with all dimensions — Categories, Brands, Sources, Methods, Products, Sheets — and can jump between them directly. The detail table extends the overview with profit KPIs (PRO feature, recognizable by the 🚀 symbol):- ASINs, Units, Ø / unit, Ø / day, Purchase volume
- ROI %, Margin %, Profit / unit, Profit (total)
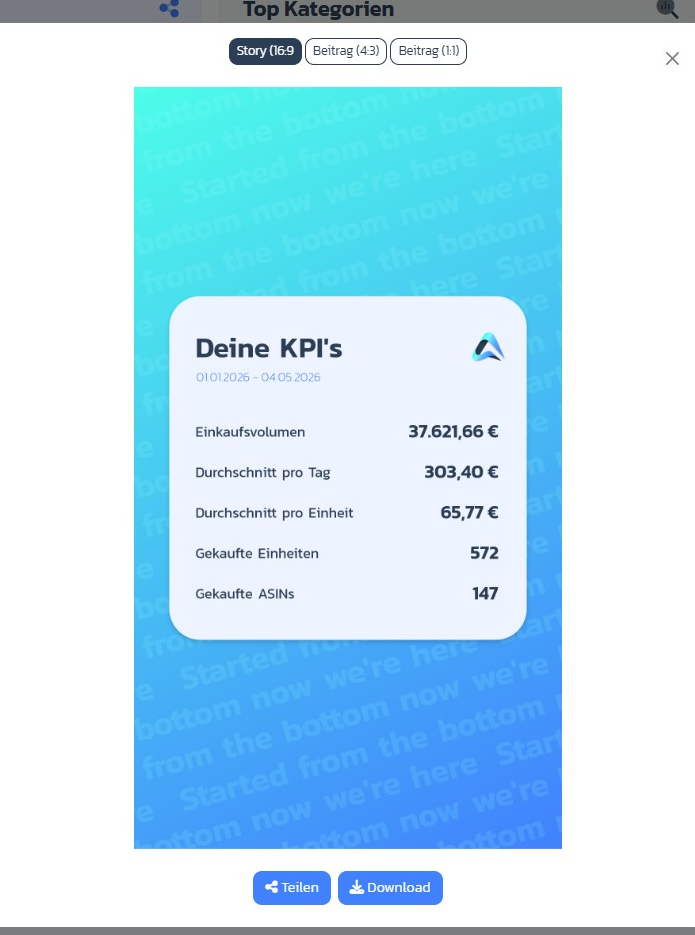
Share / download KPIs
Via the share icon on the KPI card you open the share overlay. Choose a format and click Share (system share dialog) or Download (PNG):- Story (16:9) — for Instagram/TikTok stories
- Post (4:3) — standard social posts
- Post (1:1) — square (Instagram feed)
Step-by-step: Purchase analysis for a time range
Step 1: Open the module
→ Open directly in the app: app.arbitrageone.de/purchaseanalysis In the navigation, go to Purchase Analysis.Step 2: Select sheet
At the top left choose the desired Sourcing Mastersheet — or all sheets to see everything aggregated.Step 3: Set time range
Click the date button and choose a quick range or a custom range.Step 4: Open the detail view
Click the magnifying glass icon on one of the top cards to see the full list with all brands, categories, sources, methods, products or sheets — including profit KPIs (PRO).Important notes
- Data is based on Record Purchases from your Sourcing Mastersheets — only recorded purchases flow into the KPIs.
- Values are shown in the currency of your home marketplace.
- VAs only see the sheets they have the view_analysis right for.